StatOpt is a statistical eye analysis and link optimization tool for wireline communications, developed in both MATLAB and Python 3. The tool uses statistical methods to model various wireline effects and to estimate the link performance metrics such as the bit error rate and eye dimensions (eye's horizontal and vertical openings). The tool also produces various plots relating to link performance.
Where to Download:
Click here for a Python Version of StatOpt.
Click here for a Matlab Version of StatOpt.
StatOpt Output Examples
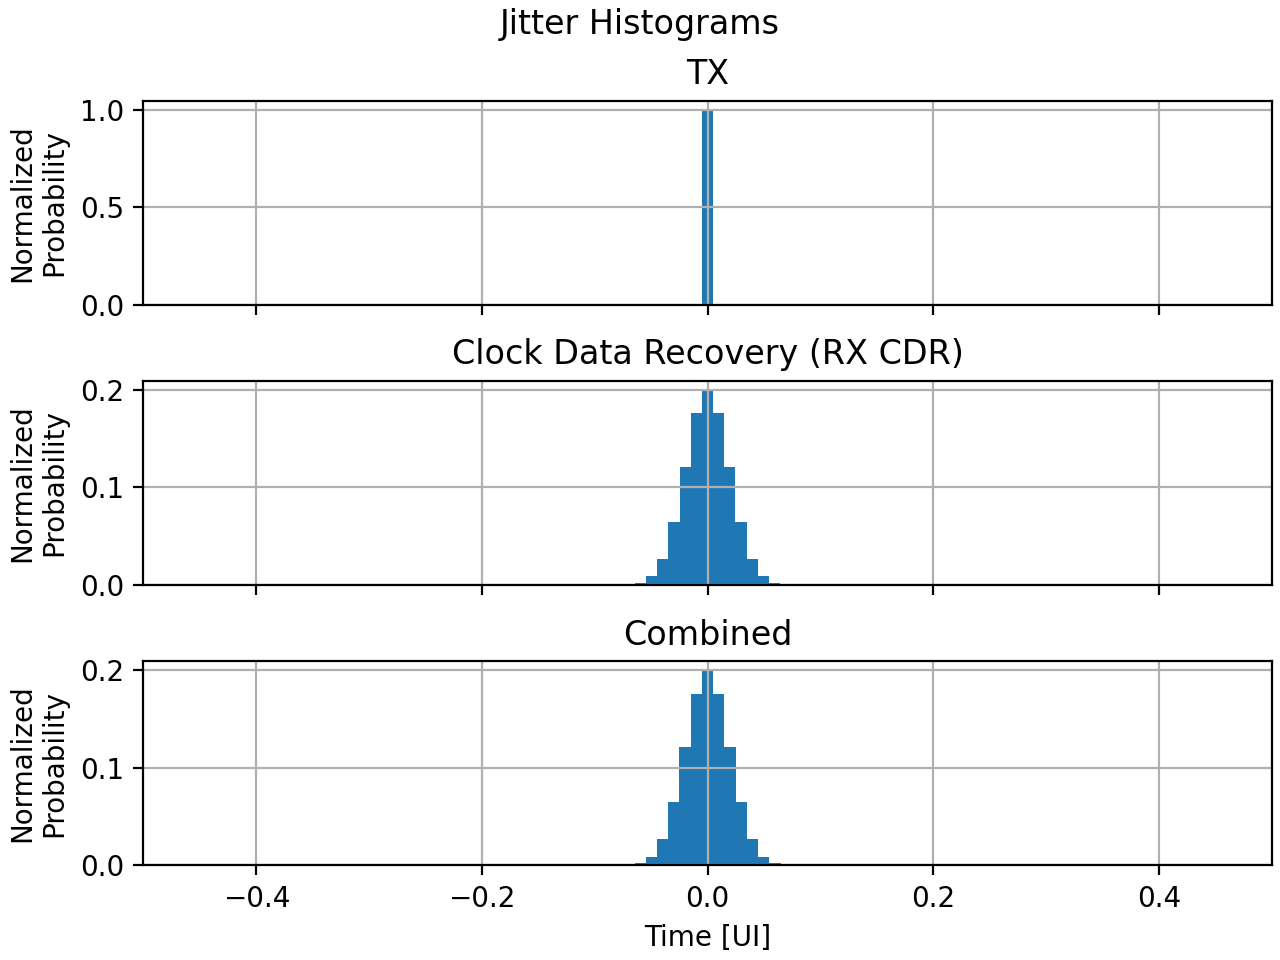
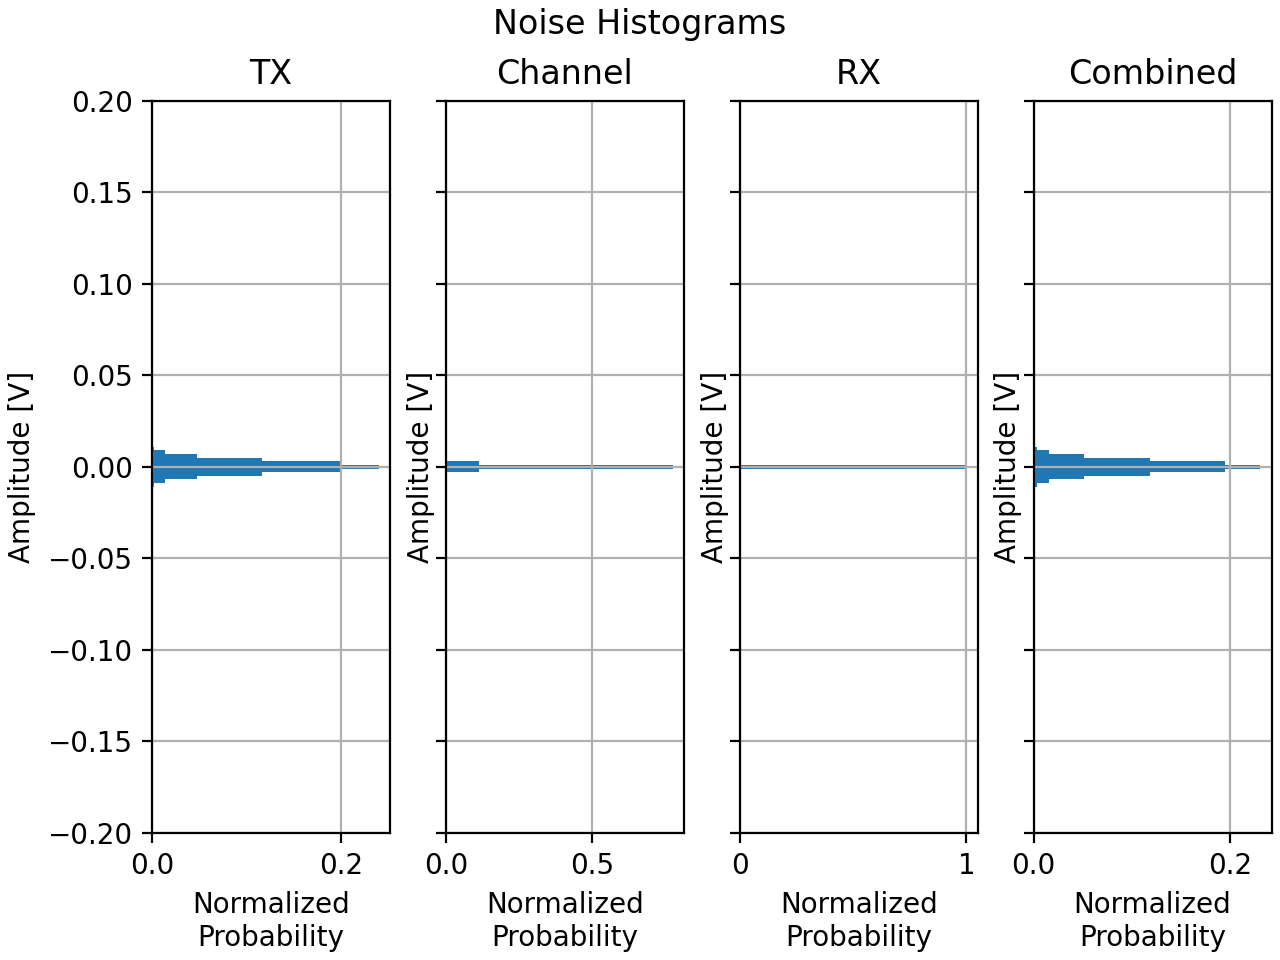
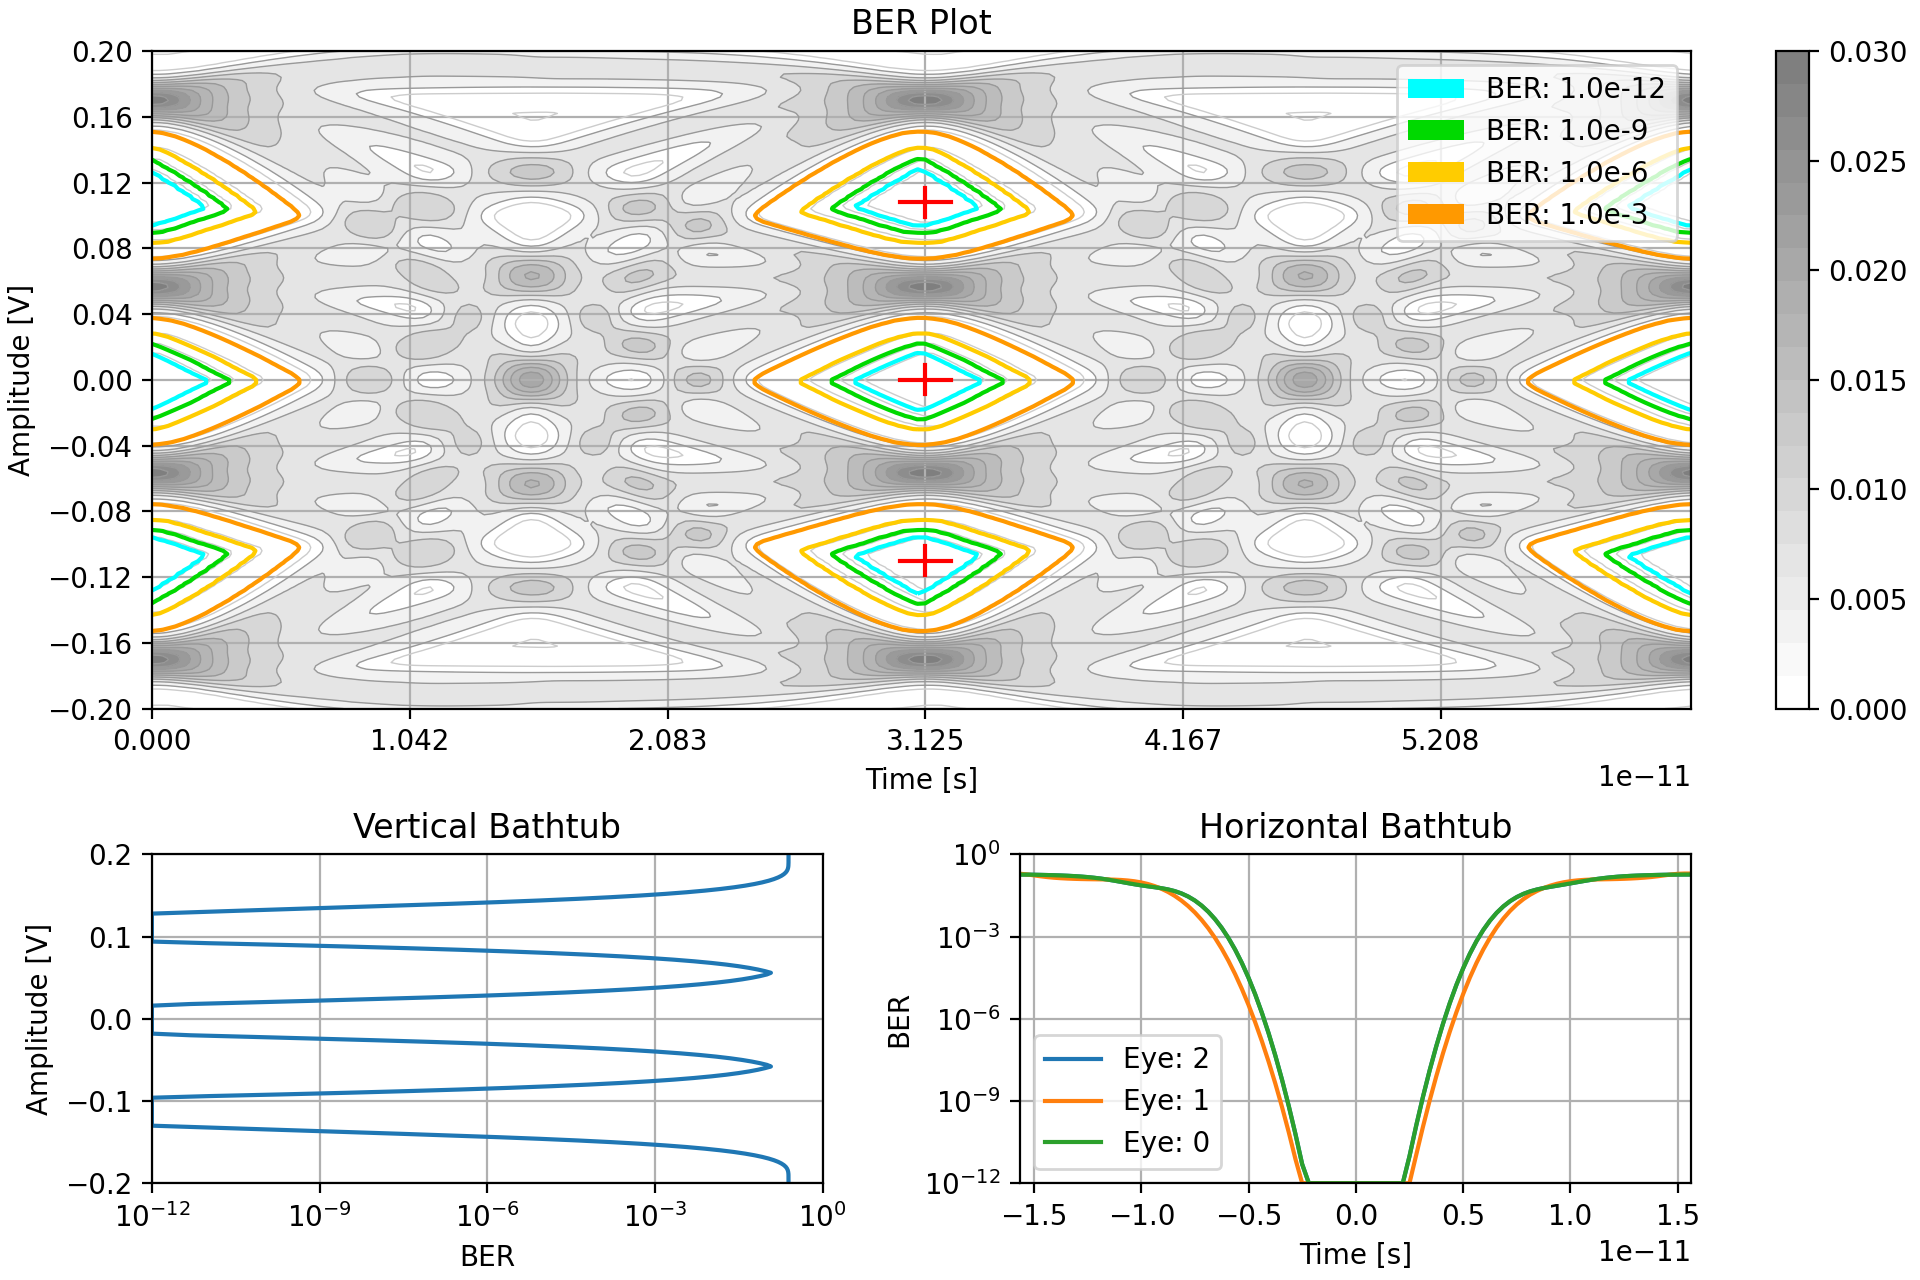
The following plots are generated by the Python version of StatOpt using the configuration in generateUserSet tingsExample0.py. Similar output plots can be generated easily by the MATLAB version.
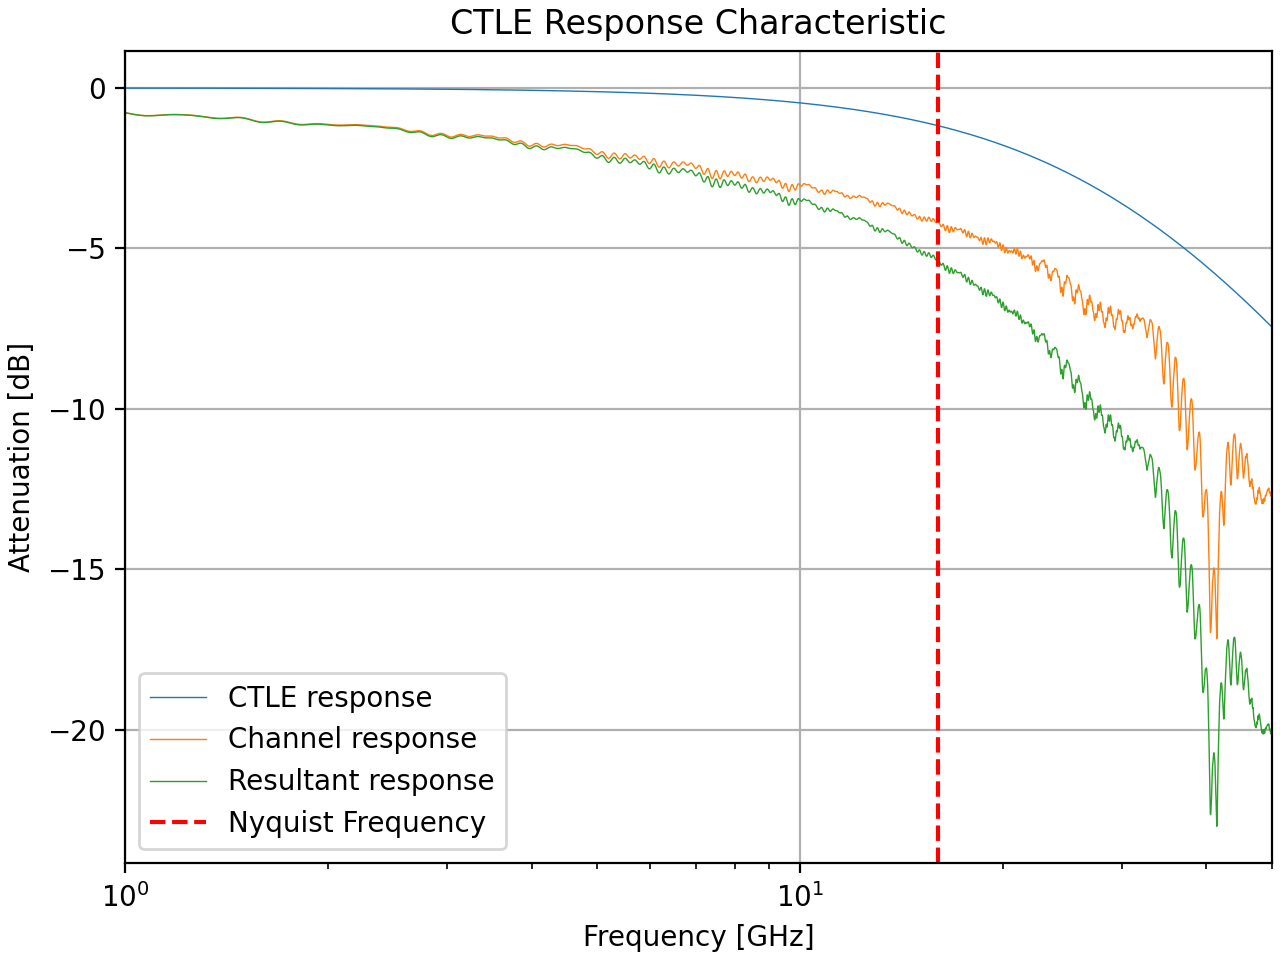
System Response characteristics 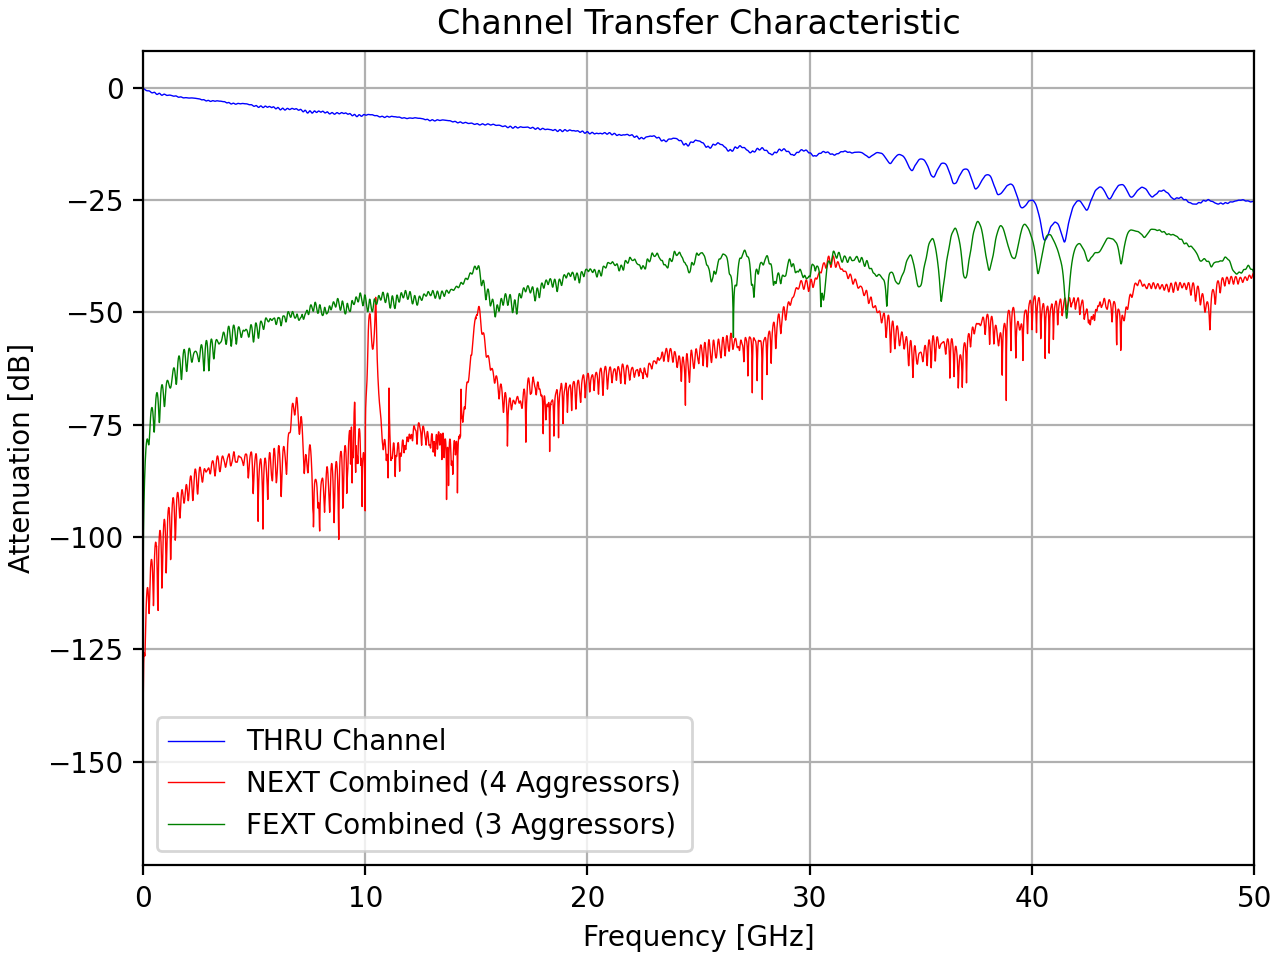
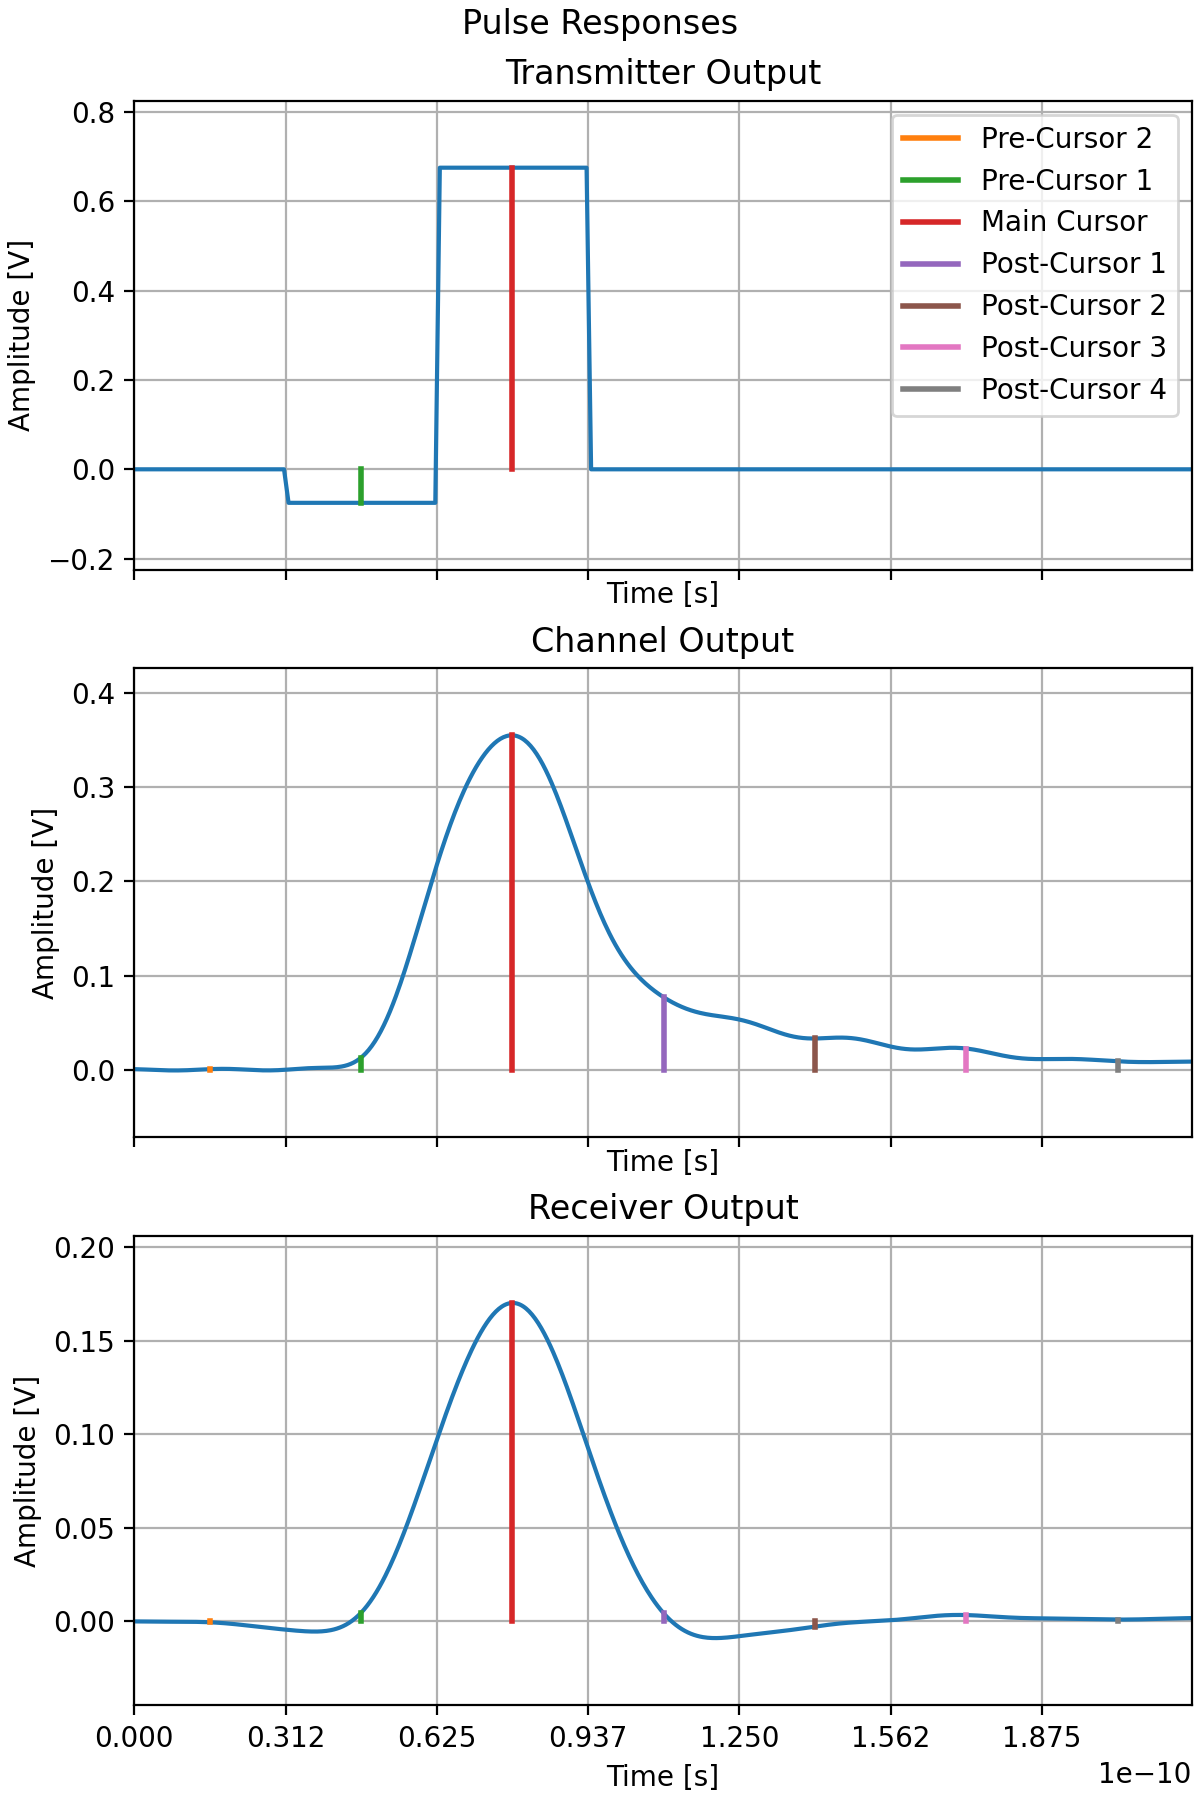
Using the pulse response with the different possible data strings to record the different possible inter-symbol interference trajectories for the system to take.
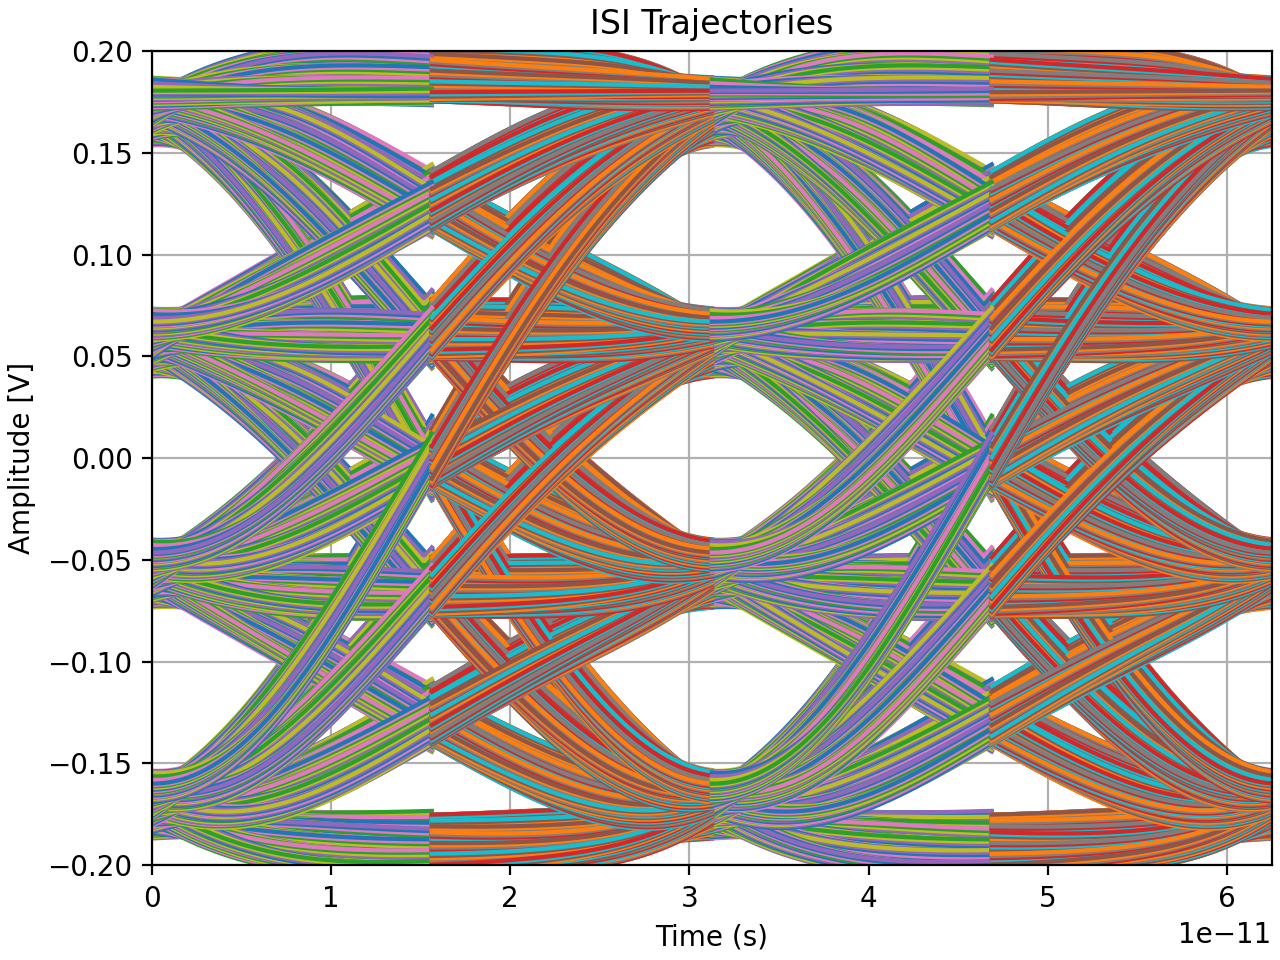
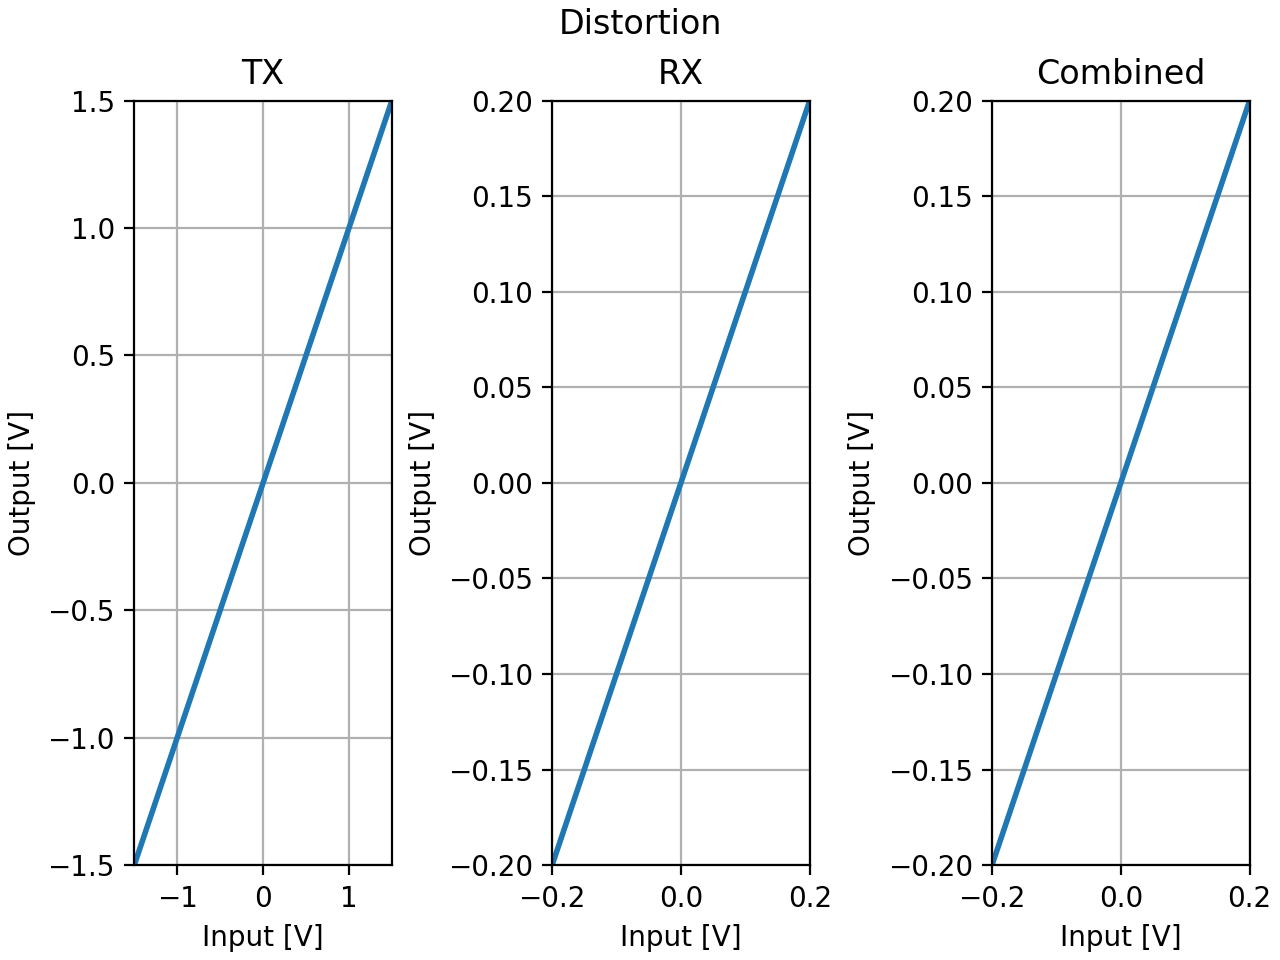
Note: in example 0 distortion is not enabled by default , hence the simple distortion curves.
Final Probability Density and Bit Error Rate
Provide Feedback:
Please provide your feedback on this tool via email to Ali Sheikholeslami.